
How to read
candle chart correctly
A popular question that many traders ask when looking at a candle chart is; What candlesticks work the best?
The answer is not that simple. There is no one or two candlestick patterns that can be used without looking at other factors on the chart.
The idea is to get a feel for the
psychology behind the price action first and then consider how the
candles can help to determine market direction.
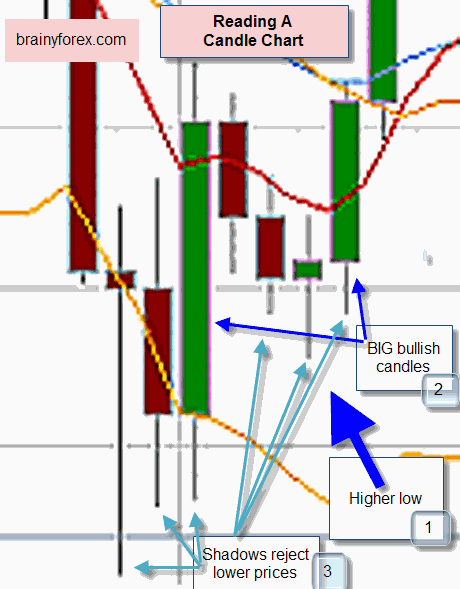
Take for example the candle chart show above. Lets read the chart based on the three items mentioned.
Number 1. Consider price pattern and time.
We
see that as time progresses a higher low is made. This is also known as
a pull back in price. Or we can even consider it as a second wave in
either a zig zag formation or a impulse wave. Which ever way we look at
it we know that it is a bullish sign indicating a high possibility of
prices moving higher.
We also notice that by counting the
number of red bearish candles as compared to the green bullish candles
that it has taken more time for the bears to prevail than the bulls. In
other words it does not take long for price to move back up once it is
pushed lower.
Number 2. Consider candlestick size.
Take
a look at the time frame we are considering on the chart and look at
how LARGE the green bullish candles are compared to the red down
candles. This shows that bulls are biding up the price and are keen to
buy. Price has a good chance of increasing, especially when increasing
volume is associated with these bullish sessions.
Number 3. Consider candle shadows.
As
shown on the chart we notice a lot of candlestick shadows, whereby
price has moved lower only to be pushed back up within that particular
time period. This shows that the buyers are keen to purchase when price
reaches a certain low level. Hungry buyers, without enough sellers means
that price will have a good chance of increasing yet further.
Summary
Points
one, two and three are the main essentials in reading a candle chart.
Once a trader understands these three points and applies this
understanding when reading charts it is all down hill from here. It is
now easy.
A trader does not need to know if the price pattern
falls into the definition of a morning star pattern, morning doji star
or abandoned baby. The trader knows straight away the significance of a
bearish candlestick, followed by a doji (open and close the same),
followed by a bullish candlestick. It means there could be a reversal
SUBJECT TO points 1, 2 and 3 discussed.
To continue reading about the underlying basics to candlestick patterns go here.
Brainyforex Newsletter [SUBSCRIBE HERE]
Brainyforex Tip - EA's to watch;
Automic Trader Click here. (Affiliate link)
King Robot Click here. (Affiliate link)
(NB : Affiliate commissions help assist running costs of brainyforex.com without any extra cost for purchaser).
Need software to test and improve your trading strategy? We have special coupon discount codes here.
Recent Articles
-
Forex Advertising is available on brainyforex.com | Forex ads
Aug 22, 23 12:41 AM
 Forex Advertising for your trading product, service or brokerage firm. Buy banner space at the lowest prices on the net for forex trading traffic.
 -
Forex Trading Systems Solutions. Tell Us.. We Listen! Everything Forex
Feb 22, 23 07:36 PM
 Don't become a victim of guru forex trading systems, forex software, forex robots or signals that don't work. Learn through articles and traders reviews & feeeback.
 -
I am a very successful trader because of his course
Jan 12, 23 10:52 PM
Five Star. Took Todd Mitchell's day trading course back in 2008 and spent 1000.00. I am a very successful trader because of his course. The course is


