- Home
- Technical Analysis
- GBP Technical Analysis 11 April 2014
GBP Technical Analysis 11 April 2014
by B.K
(Georgia)

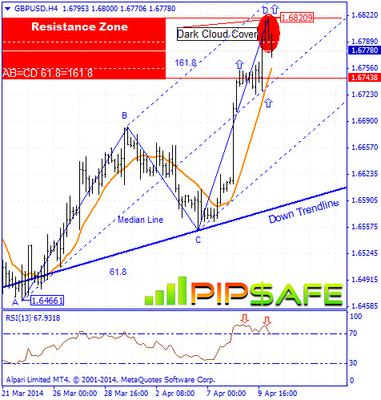
GBPUSD 4 hour chart
As it was mentioned in the previous technical analysis of GBP/USD pair dated 2014.03.11, according to the formed technical signs, there was the potential for descending of price which finally happened. Sellers were successful in achieving the lowest level of 1.64661. Right now price is above 5-day moving Daily and H4 time frames that show an uptrend during the next candles. Price has formed a Top price with reaching to the specified resistance zone in the chart (picture) above and it has stopped from more ascend and has started a little descend with shows exit of some buyers from their trades.
According to the formed price movements in the chart, between the bottom price of 1.64661 and top price of 1.68209 ,there is AB=CD harmonic pattern with ideal ratios of 61.8 and 161.8 that with completion of the D point there will be a warning for descending of price. RSI indicator in H4 time frame is in saturation Buy area that confirms the current top price and warns about changing price direction. Generally until the top price of 1.68209 is preserved, price has the potential of descending. Currently the first sign for buyers is breaking of the D point of harmonic pattern in the price chart.
Written by the technical team of PipSafe Company.
www.PipSafe.com


