- Home
- Trading Strategies
- Point Bar Forex Trading System explained
Point Bar Forex Trading System explained
by Martin
(South Africa)
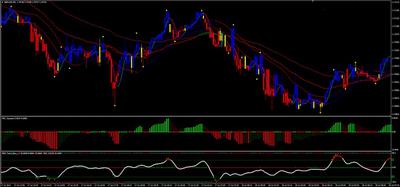
Example of Point Bar Forex Trading System GBP/USD M5
Of all the Forex strategies out there that we have had the chance to review and use, few come close to the simplicity and effectiveness of the point bar Forex (PBF) system. It is really an amazing system, but it’s not free – the creator sells it at $2,000 which is quite expensive but also worth the cost. Nevertheless, we’re not here to sell you anything, we’re going to offer it to you for free! First, how to use this system ...
The PBF indicators
After downloading the indicators and incorporating them into your trading platform, either MetaTrader 4 or 5, you will find about 8 new indicators on your platform. Here’s what they represent:
• PBF_2EMA_Colour – a type of exponential moving average (EMA) with a larger period time gap used to identify longer trends
• PBF_Fast_3MAs – another moving average, this one with a smaller period length that is used to detect smaller and immediate trends, ideal for the scalper
Together, these two moving averages help the trader establish trends in the market and decide on when to enter or exit the trade.
• PBF_iTunnel – although it looks like another moving average, it’s not, but it has the same purpose. This indicator changes colour from blue on an uptrend to red on a downtrend
• PBF_OSOB – this indicator appears below the price charts on the indicator window as an oscillating line with varying colours and dots. The varying colours on the line indicate when the market has been overbought or oversold presenting an opportunity to sell or buy respectively. The dots at the crests and valleys represent market sentiment, where red dots show a bearish sentiment, the green dots a bullish sentiment and the yellow dots indecision in the market
• PBF_SCALPER_SHOW_ME – this one can be added both in the main window or the indicator window. On the main window, it presents as yellow dots showing points at which the trend turns around. In the indicator window, it shows the levels at which the market normally ranges, above or below these points is a sign the market has been overbought or oversold
• PBF_PB_Direction – it changes the colour of the bars from not only the default green and white but blue, yellow and red. Blue candlesticks show an uptrend, red for a downtrend and yellow for a possible reversal in the trend
• PBF_SQUEEZE – it is very similar to the MACD indicator, but instead of just showing bullish or bearish market sentiment, this indicator also shows the strength of the market sentiment by changing colour
• PBF_Trend_Bars_v2 – these are 3 horizontal lines coloured red and green. When a single colour can be found on all 3 bars, it is a sign of strong market sentiment either bearish or bullish.
When all these indicators are added to the Forex charts, the chart now looks something like this.
It really looks messy right now, and it’s not advisable to have such a cluttered work space, but the advantage is that you don’t have to add all the indicators offered along this PBF system.
Just choose a few which favour your trading style and add those, only use the others to compliment your decision.
Using these indicators
When using the PBF system on shorter time frames, you want all indicators to have the same colour and the candle close above or below the moving average.
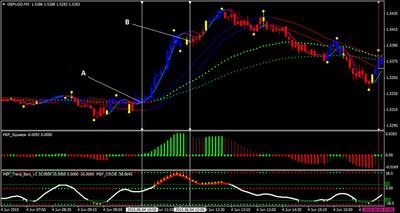
Take the example below for the GBP/USD pair on the M5 chart, the candle at point A has just entered the ‘green zone’ on the PBF_Squeeze indicator and closed above both the fast and slow moving averages. The trader who had placed a buy order at this point made a lot of pips on that trade. The yellow dots provided by the PBF_SCALPER_SHOW_ME indicator provide information of where to place the stop loss just in case the trend turns.
Later on at point B, the candles break below the fast moving average, PBF_Fast_3MAs, but not the slower moving average, PBF_2EMA_Colour or the PBF_iTunnel, so you should not close the trade just yet. And indeed what happened, the uptrend kept going.
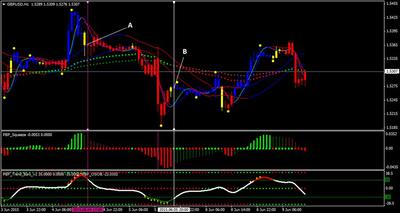
On longer time frames, though, you can’t wait for all signals to line up because then it might be too late and you get in on the trade when the trend has already been trending for some time. On these higher time frames, like the GBP/USD chart below on the H1 time frame, although price was above the moving average at point A, the PBF_OSOB indicator showed that the market had been overbought, so a sell order would have been more appropriate here. By point B, there were signs the trend was reversing, and this would be a good place to buy the pair.
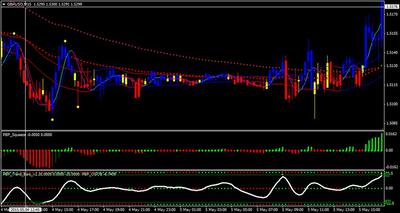
This PBF system can also be used to show times when you should not enter the markets, such as when the bars on the PBF_Squeeze indicator are so small they appear as dots. This often happens a short while before a major news announcement, and is a sign that players in the market are unsure of the trend and waiting to see what happens. From the picture below, you can see that other indicators like the PBF_OSOB are not showing signs of an overbought/oversold market, or the PBF_iTunnel changing colour. It is not advisable to get into a trade at such a time because the next move could be significant.
What’s so special about this system
By now you must appreciate the various uses of this system, but you’re still not sure why it costs $2,000. Here’s why:
1. The ability to trade any financial instrument – most 3rd party indicators and expert advisors are created by individual traders for a specific purpose, one that the trader is very good at. So, for a Forex trader, they might create a system that makes Forex trading easier, but it won’t work on, say, stocks or commodities. The PBF system, though, works for all financial instruments, and is not limited to the Forex market, which means that a trader can diversify their portfolio just by learning this system.
2. User friendliness – after installing the PBF indicators and loading them onto your trading platform, you won’t notice too much of a difference on your Forex charts. Most indicators fill up your work space with data, lines and colours, but the PBF system only alters the colours of your candlesticks without changing them too much. This unique feature makes it possible for any trader to learn how to use this system and make money off it.
3. Versatility – again, because indicators are created based on an individual trader’s style, these indicators are only effective in specific time frames and trading styles. Not so for the PBF system, which can be used by scalpers, day traders, swing traders and it can still work effectively on all time frames without any restrictions. Such versatility makes the point bar Forex system somewhat like a Swiss Army knife for a Forex trader.
Information about the Point Bar Forex System was provided by Top Forex Brokers

