- Home
- Ifc Markets
- Technical Analysis USDCAD: 2 October 2014
Technical Analysis USDCAD: 2 October 2014

Daily Chart USD/CAD 2 October 2014
US Dollar Vs Canadian Dollar
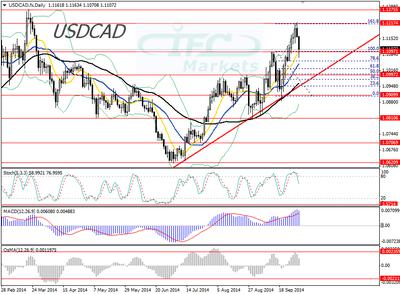
Today we are going to look into the US dollar against the Canadian dollar chart pattern. In the last trading sessions upside bias drove prices to recent cap at 1.1217 and in the last two daily trading sessions prices retreated due to overbought indicators. The cap at 1.1217 could be a strong one since is at the 161.8% Fibonacci level of the retracement from 1.1097 to 1.0909. Moreover, the Simple Moving Averages are below prices which increase upside momentum and the valid rising trend line remains in place confirming bullish development. Based on the price pattern we could see a pull back at the support at 1.0997 and we could take advantage of that retracement although is too risky ahead of the Non-Farm Payrolls release. Yesterday the release of private employment showed higher job creation in September and that gives a signal of a possible stronger NFP in September as well. We should check oscillators and volume for further clues before establishing an opinion.
Furthermore, at the above chart we can see the daily volumes of futures and options traded on the Chicago Mercantile Exchange. It is observable, that on the second half of September the volume of trading was steady, more specifically the volume peaked at 11 of September when prices peaked at 1.1097 but at the higher high of prices at 1.1217 the volume did not follow. That could be a warning signal for the bulls since they seem to be fading.
Looking at the oscillators, the Stochastic has been in overbought zone and now is falling. The MACD is in positive ground but at extreme highs and the OsMA was limited by previous peaks line. In our opinion, we would expect the retracement to continue lower or extend in a sideways path. Upside revive seems possible amid strong up trend but the bulls are weak as the volume analysis revealed. Nevertheless we are ahead of major economic releases which could create new bullish bias and boost the USDCAD. One last thing to keep in mind is that the resistance at 1.1275 is a five year peak and is considered a strong one, likely to limit any bullish attempt.
Daily Technical Analysis by IFC Markets
Read previous articles by IFC Markets here
Return to IFC Markets Articles.


