
October 01, 2009
Critical level
Welcome to the brainyforex newsletter special commentary.
Critical level for US Dollar
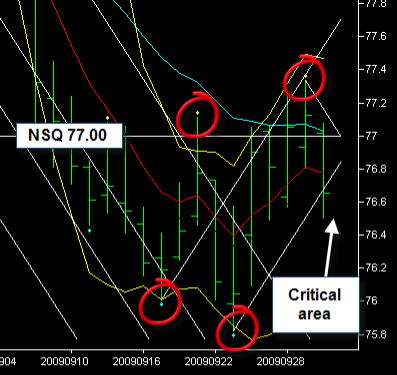
US Dollar Daily Chart 1 October 2009.
[Remember that we use the US Dollar as our main indicator to show us which direction other currencies paired to it will move.]
As seen from the above chart we notice that price is in a critical area, moving near the 77.00 natural square support / resistance zone.
If price moves above the 77.00 level this will mean that it is setting up for another short term upward thrust, thereby driving AUD, EUR and GBP downwards.
Alternatively, on the other hand if price moves under today's low we will see a break in the vibration level (white line on chart) meaning weakness. This will cause AUD, EUR and GBP to move upwards.
Notice too on the chart the swing highs and lows have not settled in a trending pattern yet. We see swing three and four (as circled on chart) at odds with each other. To see the ideal pattern we would like to see a SECOND lower swing high for a bearish move or a SECOND higher swing low for a bullish move. We do not see this second confirming swing at this moment in time.
A suggestion is to wait over the next day or two to see where price moves. Will it move above or below the 77.00 natural square level? Once this is shown, then we will have a closer look at the paired currencies for a possible trade.
Till next week
Fritz
www.brainyforex.com