
July 29, 2009
USDCAD
Welcome to the brainyforex newsletter special commentary.
USDCAD
Our forecast for the week ending 10 July informed us that the USDCAD may experience weakness if it fell below the 1.600 level.
Refer forecast Forecast USDCAD
Look at week ending 10 July 2009.
We could see the possibility for this due to the completion of the upward 2 day zig zag formation as well as break of the vibration level and break of the natural square level.
The chart below shows what took place.
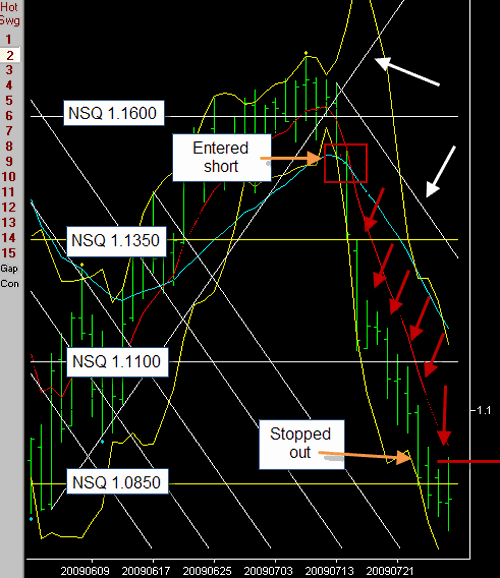 USDCAD Daily Chart 28 July 2009.
Notice the white arrows show the vibration lines. The natural square levels are shown on the left, abbreviated NSQ.
Half of the position closed for a quick profit, with the other half of the position followed down with a stop loss order just above the prior days high. Shown by the red arrows.
I entered two short positions on the 13th. For the first position I set a profit target at 1.1360 which was just above the natural square level. This target was reached overnight with a profit of + 160 pips.
The second position was stopped out on the 16th with profit of + 295 pips. My forex brokers data was a bit different from that shown in my third party software data. This meant that the prior day was exceeded which closed out my position. If your brokers data was similar to that shown in the chart above you would have been closed out of the trade on the 28th at 1.0882 for a profit of + 627 pips. This was a magnificent run of 10 days in a row where prices did not exceed the prior day high.
Normally such long straight price runs do not take place. It does show we have to be ready to catch these golden trades when they present themselves. Nobody knows how far price will run for, so all we do is get on board and if things don't go according to plan, just exit the position and try the next trade.
Till next week
Fritz
www.brainyforex.com