
June 02, 2009
EURUSD Looking forward from 22 May 09
Welcome to the brainyforex newsletter special commentary.
This week we are having a closer look at EUR/USD. The colored arrows will draw your attention to the different aspects of the forecast.
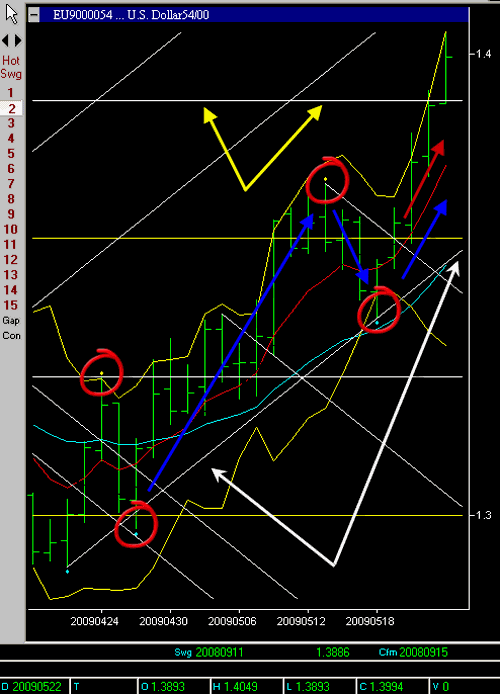
Daily chart
- Blue arrows show 2 day swing points consisting of a zig zag formation. Very bullish formation.
- White arrows show vibration level. There is no fear of market reversing until break of vibration level. We currently see healthy uptrend.
- Red arrow shows direction of 7 (EMA) exponential moving average pointing upwards.
- Yellow arrows shows natural square level of 1.3900 exceeded. Next resistance level is 1.4200. To take any long positions we need to see price staying above 1.3900 level.
Daily chart of Euro
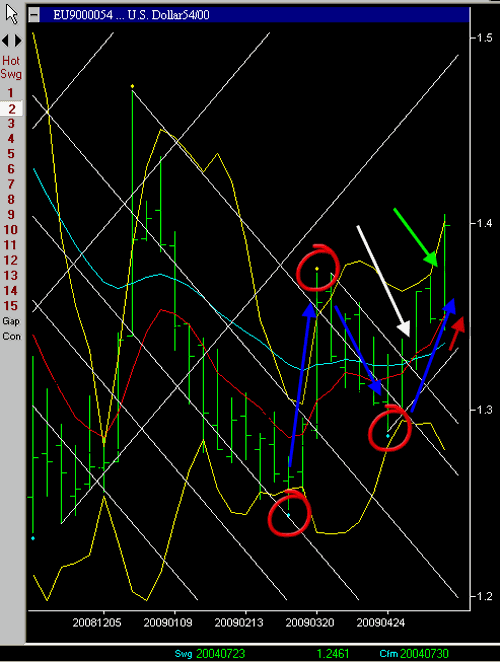
Weekly Chart Euro
Same principles apply to longer term charts as for daily charts.
- Blue arrows show 2 period swing chart zig zag formation. Very bullish.
- White arrow shows break of vibration line to upside. Very bullish.
- Green arrow shows price moving above prior week. Very bullish.
- Red arrow shows upward direction of 7 period EMA. Bullish.
Weekly chart of Euro
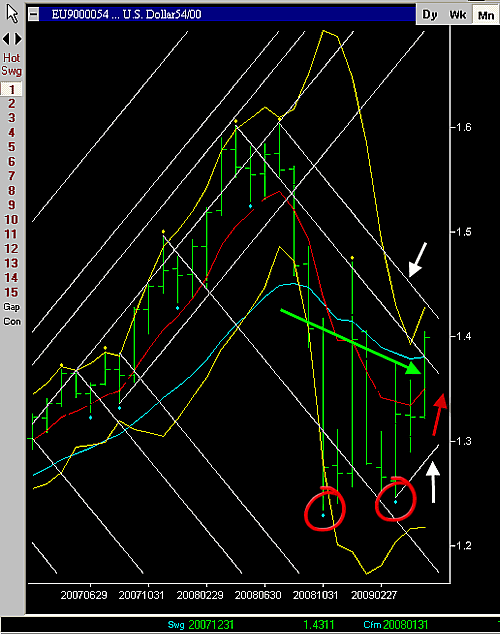
Monthly Chart Euro
- Red circles show swing low made double bottom. First sign that price decline has halted.
- Green arrows show prior month exceeded to the upside. Bullish sign.
- Red arrows show 7 period EMA moving upwards which is bullish.
- Notice white arrow shows price soon to come into resistance from monthly vibration level of around 1.4200. Which corresponds to our natural square level of 1.4200.
Monthly chart of Euro
Lets see how the week went
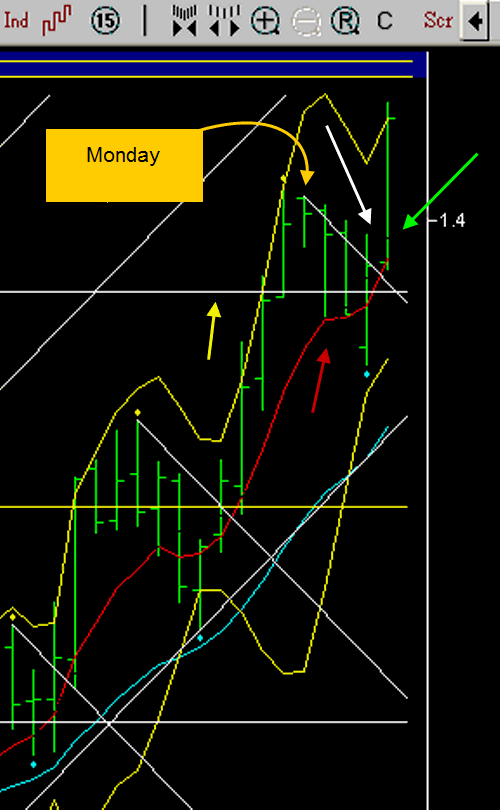
Daily Chart Euro
Starting Monday price declined each day until big upward move on Friday.
- Yellow arrow = Vibration level 1.3900.
- Red arrow = 7 EMA.
- White arrow = Break of vibration level.
- Green arrow = Prior day exceeded
Daily chart of Euro
This week we can expect yet again, further upward price movement as long as price holds above the 1.3900 natural square level. Next barrier is 1.4200 natural square price level. Watch to see how price reacts at this level. Will it move through this level quickly? or will it stop there? Watch and see. If it develops a double top near this level, expect price to stop or stall at that point. The next few days or next week will provide us some clues.
Till next commentary
Regards
Fritz
brainyforex.com