
June 17, 2009
What's happening to Spot Gold?
Welcome to the brainyforex newsletter special commentary.
This week we take a look at Spot Gold
In our earlier forecasts for spot gold we believed that price would continue higher as long as the natural square level of 963.00 was not breached to the downside. Refer forecast Forecast spot gold
This natural square level as shown on the daily chart was breached indicating start of weakness for the gold price.
Next on the chart we see the red arrows showing 2 day downward swing in the form of a zig zag.
The white arrows show the position of the vibration lines. Notice, the lower vibration level has just been breached which shows the price is really weak.
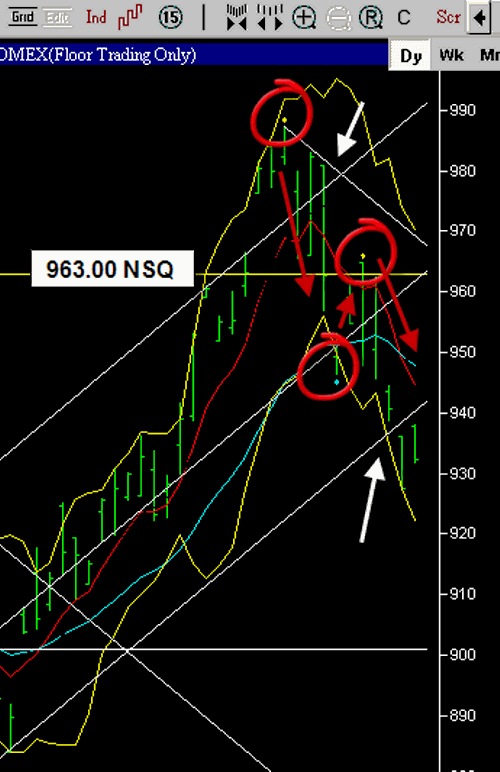 Spot Gold Daily Chart 16 June 2009.
Lets look at the weekly chart
The white arrow labeled with number one shows vibration level breached indicating the powerful upward move that recently took place.
The green arrow labeled number one, confirmed upward move when the price exceeded the prior weeks high.
We contrast this to the situation with arrows shown with number five. Price under influence of higher vibration level. Price needs to wait on time before it can start moving higher again. It needs to complete its downward time cycle.
The green arrow with number five shows price moved below prior week low. A sign of weakness in the price.
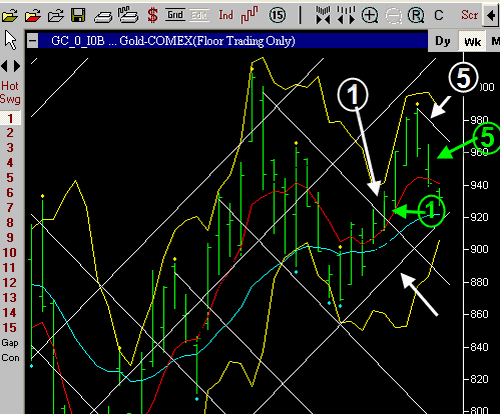 Spot Gold Week Chart 16 June 2009
Summary
Gold has lost its upward moving momentum for the present. The 963.00 level is now a major resistance level with the forming of the upper vibration level. (In addition to the natural square level). Both levels agree at 963.00.
From here, the 920.00 level (approx) is weekly vibration support. If price cannot hold around the 920.00 level, lookout below...
If world events thrust gold above the 963.00 level, it will mean further large quick price increases from there.
Till next week
Fritz
brainyforex.com