- Home
- Ifc Markets
- Technical Analysis EURUSD 27 October 2014
Technical Analysis EURUSD 27 October 2014
by IFC Markets

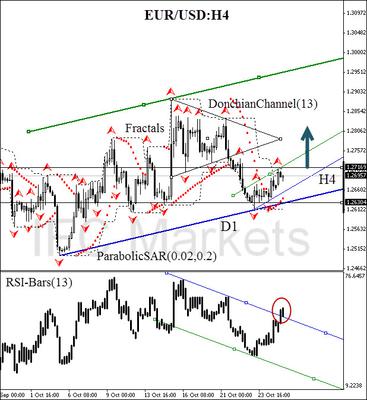
EUR/USD 27 October 2014, H4 chart
Euro Return Expectation
The main fundamental event for today is the German Ifo Business Climate release at 10:00 CET. The composite index is based on a survey conducted among manufacturers, construction companies, as well as wholesalers and retailers, calculated by German Institute for economic research Ifo. Each month a survey is run among 7000 business representatives regarding the favorable business climate and market expectations for the next six months. Note that the index is interconnected with the main macroeconomic indicators of the EU. Rapid reaction to changing business climate provides leading signals relative to possible changes of spending costs, investment funds and attracting manpower in Germany.
The index includes 2 indicators: assessment of the current economy state and evaluation of expectations. The second component has a greater importance for investors. The German economy remains the main driver for the European markets development: more than 20% of the EU GDP. This is the biggest rate among other European member states. For this reason, we expect the Ifo index to affect greatly the European currency rate.
Here we consider the EUR/USD currency pair on the H4 chart. The price broke the lower triangle side and was moving steadily into the red zone, until it was stopped by the primary daily trend. At the moment there is a H4 trend reversal influenced by bulls, as well as the Parabolic trend indicator: we are looking forward to the movement continuation. Note one of the most significant signals: the 30-day resistance breakout of the DonchianChannel and the trend line upward breakout of the RSI-Bars oscillator (marked in red ellipse).
Thus, all the analysis methods indicate the most probable euro uptrend continuation. As an ultimate signal, we expect the fractal high breakout at 1.27169, which may be used for opening a pending buy order. Stop Loss is recommended to be placed below 1.26304. This support level is confirmed by the strong daily trend line, and also Parabolic historical values.
After position opening, Trailing Stop is to be moved after the Parabolic values, near the next fractal low. Updating is enough to be done every day after a new Bill Williams fractal formation (5 candlesticks). Thus, we are changing the probable profit/loss ratio to the breakeven point.
Position Buy
Buy stop above 1.27169
Stop loss below 1.26304
Daily Technical Analysis by IFC Markets
Read previous articles by IFC Markets here
Return to IFC Markets Articles.


