Candlestick Trading Patterns
There is no doubt that every trader can benefit from candlestick trading. With the permission of the makers of the candlestick crash course brainyforex has copied some of the price patterns to show the terminology behind a doji, spinning top, shooting star, hammer, gravestone doji, dragonfly doji and a couple of continuation patterns.
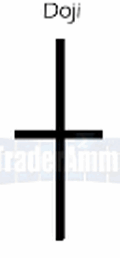 Candlestick Doji Candlestick Doji |
Doji is probably the most widely reverse pattern. A doji occurs when the open price of a candle is the same as the closing price of the candle. When we see a doji emerge, this can be interpreted as indecision in the market. After all the buying and selling has taken place, the price hasn't moved, the market is unsure of the direction it will head. This is often a precursor to the market changing direction. |
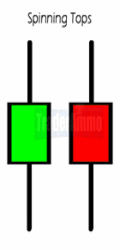 Candlestick Spinning Tops Candlestick Spinning Tops |
Spinning Tops are represented as candles with small bodies and large wicks. The wicks should always be larger than the actual body of the candle. The color of the candle doesn't make a difference; the important point is the large wicks in relation to the small body of the candle. Like the doji, this represents wavering market opinions about the overall direction. The long candles are formed by the market being bid up and subsequently sold off. |
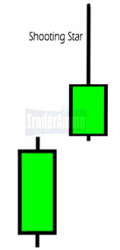 Shooting star Shooting star |
Shooting Stars occur when we see a bullish gap with the next candle containing a large upper wick. This wick represents a changing market opinion. The bullish gap and pursuing run up represent bullish sentiment while the large wick represents bearish price action. The upper wick should be at least twice the candle body. Shooting stars are reliable indicators that are most often seen when evaluating stock patterns. |
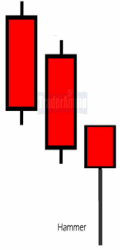 Hammer Hammer |
Hammers occur at towards the bottom of down trends. The Final candle in a hammer pattern has a long lower wick, representing a change in recent market direction. The lower wick should be at least twice the candle body. The market is said to be "hammering out a bottom". Using this candle pattern in conjunction with other reversal indicators tends to be a good combination for picking tops and bottoms in various markets. |
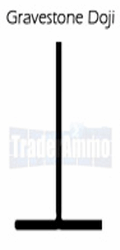 Candlestick Gravestone Doji Candlestick Gravestone Doji |
Gravestone Dojis occur when the candle closes at or near the low of the day. If the gravestone doji is seen at the top or a trend, it is a very bearish signal (the longer the upper wick, the more bearish it is). Towards the top of a trend, this is a solid indication that the market is simply failing to rally. Using this candle pattern in conjunction with overbought/oversold indicators tends to favor trades that are targeting short term reversals. |
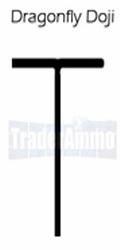 Candlestick Dragonfly Doji Candlestick Dragonfly Doji |
Dragonfly Dojis occur when the candle closes at or near the high of the day. This is considered bullish as all attempts at downward price action had been reversed before the close. As with the Gravestone doji, the longer the wick the more bullish the market should be considered. When found at bottoms of trends, the Dragonfly Doji is considered a powerful reversal signal. |
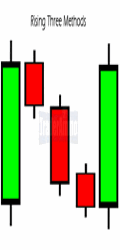 Candlestick Rising Three Method Candlestick Rising Three Method |
Three Methods is a 5 candlestick pattern, the image to the left is a rising (bullish) three methods pattern. The pattern starts off with a large bar in the direction of the trend, followed by 3 consecutive bars against the trend. The final bar is a bar that is larger than the 3 combined bearish bars. The three bearish bars are simply the market taking a "rest" from its current trend. The final bullish bar is a clear sign that the market will continue with its current trend. |
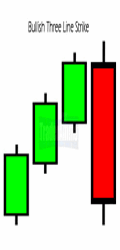 Candlestick Three Line Strike Candlestick Three Line Strike |
Three Line Strike is a 4 candlestick pattern that appears within a clear-cut trending market. The image to the left is the bullish example of a three line strike. The pattern contains three consecutive bull candles followed by a large bearish candle. The bearish candle is an example of profit taking and hesitation by buyers to jump into the market (because short term, the market is overbought). The bearish version would be three bearish bars followed by a large bull bar. |
Learn the basics behind candlestick trading theory here.
If you are interested in looking at more candlestick patterns, a good free site is www.candlesticker.com.
and also Wikipedia shows all the simple and complex candlestick patterns http://en.wikipedia.org/wiki/Candlestick_pattern
Return home from candlestick trading


New! Comments
Have your say about what you just read! Leave me a comment in the box below.