Price action moves
in two and three sections
In all freely traded markets price action consists of two or three
thrusts upward or downward before the market takes a breather or
reverses. This was the observation noted by WD Gann.
Let's take a look at a few examples and find out more.

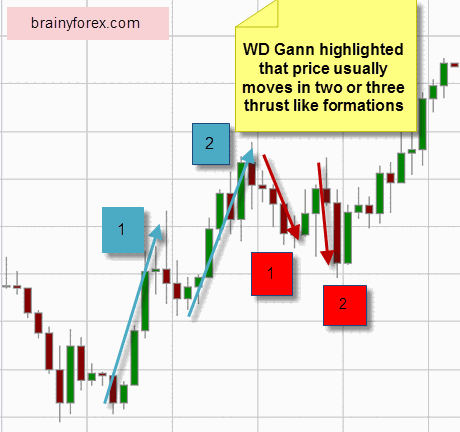
On the above chart with is the EUR/USD we see typical price move of
two upward thrusts of price. This is shown by the blue arrows.
After the two stage move we notice a reversal with consists of a
TWO thrust move toward the downside. This is a pullback shown by the red
arrows.
After the pullback we see a THIRD bullish thrust to the upside.
Hence, the price action consists of 2 thrust move up, followed by 2 thrust move down, followed by another (3rd) thrust move up.

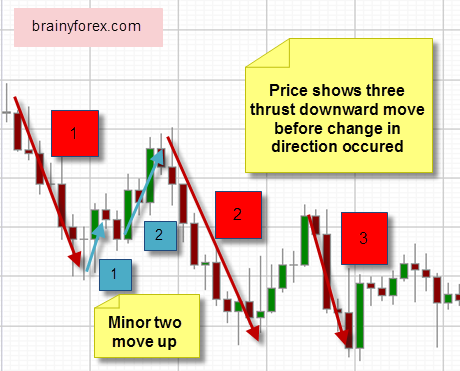
On the above chart of the Euro we see price action consisting of three clear thrusts to the downside. (Red arrows). Notice after the first thrust that a smaller two wave thrust (Blue arrows) occurs which is a minor retracement.

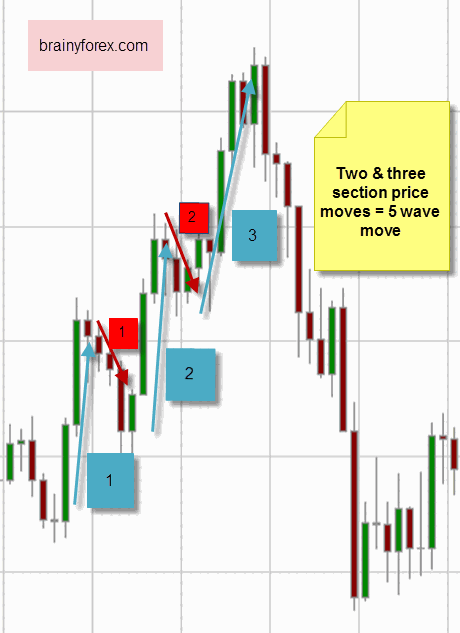
The above chart is the AUD/USD which clearly shows a three thrust
move to the upside. (Blue arrows). If we take into account the pullbacks
(shown in red) that separated the bullish upward move we have a perfect
five wave price pattern. And notice what happen after it's completion
... price fell.
WD Gann suggested that when reading charts, speculators be aware of these TWO and THREE thrust movements that occur on a regular basis in the markets.
Current Euro Chart
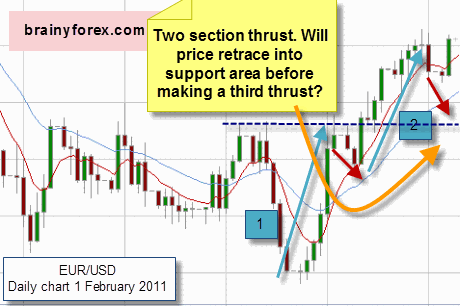
The chart below is the current daily EUR/USD as at 1 February
2011. As shown we see two bullish upward thrusts in the price. We can
now consider the possibility that price 'may' retrace back towards
former support area (shown by second red arrow and orange arrow) before
making it's third upward thrust.
As we see a bullish candle as the last price move, we can also consider the possibility that price will continue to move up straight from here a little further AND THEN RETRACING BACK TOWARDS THE SUPPORT AREA which will then equate to a 50% pullback of the current bullish move.

More Practical Application
Learn more about WD Gann's technical analysis as applied to EUR/USD currency pair. Check it out at brainyforex here.
How Do You Feel About This Topic?
What are your thoughts about this? Share it!


New! Comments
Have your say about what you just read! Leave me a comment in the box below.