- Home
- Ifc Markets
- Technical Analysis AUDUSD: 3 October 2014
Technical Analysis AUDUSD: 3 October 2014

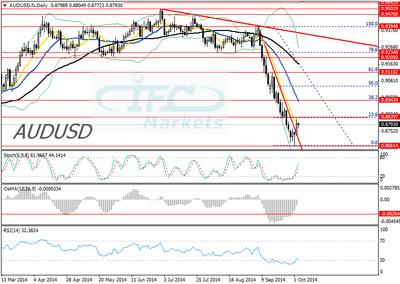
AUD/USD 3 October 2014 Daily Chart
Australian dollar versus the Greenback
Today we are going to analyze the Aussie against the US dollar chart. The currency pair bearish bias drove prices to a more than an 8-month low at 0.8661. Downside structure has been strong as indicated by the steep falling trend line. The steep falling trend line though was breached yesterday after the formation of a “Hammer with bullish Engulfing candlesticks”. That also shows the AUDUSD is making its larger correction since the 5th of September. The 10 day moving average is now limiting the pull back slightly below the resistance at 0.8839, however prices could continue to 38.2% Fibonacci retracement at 0.8934. Lastly, the support at 0.8661 appears to be a strong one because is the second time that maintains a strong bearish wave.
Furthermore, at the 2nd above chart we can see the daily volumes of futures and options traded on the Chicago Mercantile Exchange. It is observable that after the September 12th the volume of trading remained at lower levels while prices have been declining suggesting that the bears are getting weaker.
Looking at the oscillators, the Stochastic is rising following the corrective move of prices and is trading in neutral zone at the moment. The OsMA has moved towards the zero line and is gradually advancing while the RSI (14) is now in up trend. In our opinion, prices are entering a period of retracement mood after overextension of the downside move however bulls do not seem willing to return in the market. Moreover, the today’s major US employment report is likely to shake the AUDUSD and could trigger a new selling wave in the short term. We do not expect the support at 0.8661 to be penetrated given its importance. Also according to the volume analysis bears’ power is fading and sooner or later a deeper correction is likely.
Daily Technical Analysis by IFC Markets
Read previous articles by IFC Markets here
Return to IFC Markets Articles.


