Trading the Euro Currency
as shown by WD Gann
As we are considering trading the Euro Currency by Gann analysis we shall turn our attention to the weekly chart.
Gann said that the best chart to get an idea of where the trend was heading was the "WEEKLY CHART".
Last time we considered the Euro yearly chart in relation to finding the most powerful area of support and resistance which is 50% level of the all time high and all time low. We saw that this level was just above the 1.2000 price level and does not affect our analysis right now. You can read more here.
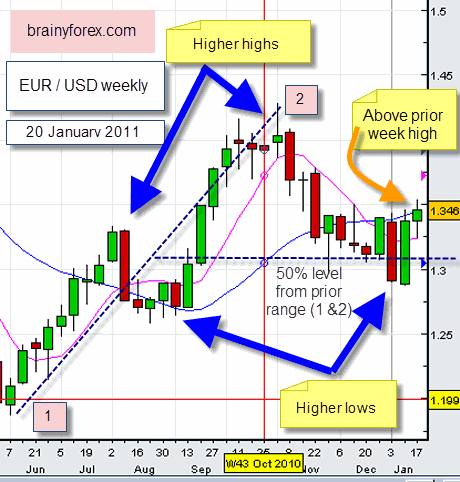
From the Euro chart below we now consider other areas of interest that WD Gann stipulated in relation to technical analysis.
Watch for higher highs and higher lows
In
an upward moving market, price will show it direction by making higher
highs and higher lows. Refer to the blue arrows on the chart. The
opposite is true in relation to a downtrend, lower highs and lower lows
will show clearly.
50% level on prior trading ranges
As
shown last week, not only are the all time high and all time low 50%
level important, we also know that price retraces often back around 50%
of its prior move. This applies to any time frame. Price seems to have a
natural attraction to balance itself. This obviously comes from traders
psychology whom start buying again (or selling) once price has reached
this half way point.
Gann also considered breaking up this 50%
level once again by 50% to get the 25% and 75% levels of trading
ranges. It is interesting to note that Fibonacci levels are very
similar, with 61.8% being a notable level.
Break of prior period highs and lows
Gann
also taught that once price broke above the prior weeks high this was a
bullish sign. This also includes other time periods as well. For
example a break above the prior year high was very significant. The same
applies in reverse for breaks under the prior periods, indicating
weakness in price.
Also, notice on the chart how last weeks price candle was bullish. There were more buyers for the Euro than sellers, showing that price ended the week on a weekly high. Learn more about candles You can read more here.
From
our analysis so far, we can see that the Euro based on the weekly chart
is in a bullish upward phase. Position traders whom hold positions for a
few weeks would consider buying the Euro/Usd currency based on the
technical analysis expounded by Gann.
[Note that this is not a suggestion for readers to buy the Euro currency as you must do your own analysis and take responsibility for your own investment decisions, as well as know where to place your stop loss should the market make a reversal. Refer disclaimer below.]

More below;
Market moves in two & three sections at a time
Read price action by watching out for two and three thrust moves. Go here.
Price may react at round numbers
Take a look at how price has reacted to these round numbers over the last few weeks here.
Return home from trading euro currency


New! Comments
Have your say about what you just read! Leave me a comment in the box below.