
Market Depth for Forex
Looking at the market depth in forex is a worthwhile exercise. It lets us know at what price levels there is potential support and resistance.
It's a fact that prices can only move in a given direction if there is an imbalance between buyers and sellers. For prices to move upwards there needs to be more buying volume than selling volume at any give price point / level. The converse is true for prices to move downward, there needs to be more contracts willing to be sold at a given level than the amount of contracts willing to be bought.
It's just the basic forces of supply and demand at work which govern the price for anything bought and sold.
A great place to get market depth for the forex market is through Oanda.com. The link is http://fxtrade.oanda.com/analysis/historical-open-orders
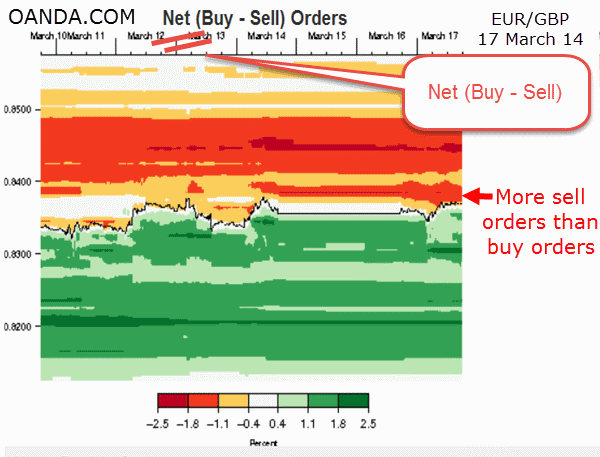
The chart above (courtesy of Oanda.com) shows the EUR/GBP at 17 March 2014.
Notice on the chart just above the current price level of 0.83717 there are more sell orders than buy orders. This provides an indication that price will be battling to move higher from this point forward. It does not mean that price will not advance from here. It just means that there is a high probability that any advance will be slow and difficult if price continues to move northwards.
If the technical analyst were to look at a weekly or month chart it shows clearly that at around 0.8400 there is major resistance. Once this is compared to the above market depth we can see that there certainly are more sellers than buyers between 0.8400 - 0.8500 as indicated by the red shaded area. In particular, notice the darker red at 0.8450, indicating a lot more sellers than buyers at that point.
The forex trader whom is currently long on the EUR/GBP would be prudently looking at taking profits very soon. If not now then around the 0.8400 to 0.8450 level.
Looking at market depth is just another indicator in the currency traders toolbox. It's not perfect, but when combined it with other techniques and indicators it can provide a better insight into the market and more confidence into the correct direction to trade.
So how did this Market Depth Analysis work out?
Several weeks have now passed and how did Market Depth Analysis work out?
The above content was written on the 17th March 2014 when EUR/GBP was experiencing an uptrend at 0.83717. Then as shown on the chart below we see price moving upwards the next day on the 18th March and almost reaching 0.8400 and then after that price has moved down very steadily to 0.8268 as of today 2 May 2014.
Notice, after the 0.8400 resistance level was rejected a double top occurred as well as a break of the swing low. After this, notice again the second double top near the red arrow.

Brainyforex Newsletter [SUBSCRIBE HERE]
NEW - Forex Tester Software is now available online without download. Click here (Affiliate link).
Brainyforex Tip - EA's to watch;
King Robot Click here. (Affiliate link)
(NB : Affiliate commissions help assist running costs of brainyforex.com without any extra cost for purchaser).
Need software to test and improve your trading strategy? We have special coupon discount codes here.
Recent Articles
-
Forex Trading Systems Solutions. Tell Us.. We Listen! Everything Forex
Jan 06, 25 09:57 PM
 Don't become a victim of guru forex trading systems, forex software, forex robots or signals that don't work. Learn through articles and traders reviews & feeeback.
 -
Fund Recovery
Dec 12, 24 11:56 PM
“This platform is extremely unreliable and should be avoided. Despite expecting a professional experience, I ran into severe challenges. When I attempted -
Forex Advertising is available on brainyforex.com | Forex ads
Aug 22, 23 12:41 AM
 Forex Advertising for your trading product, service or brokerage firm. Buy banner space at the lowest prices on the net for forex trading traffic.


