- Home
- Market Outlook
Forex Market Direction. Where Are The Currencies Heading? Find some ideas below
Knowing the overall forex market trend for the major currencies will
prove beneficial for staying on the right side of the market. Forex
Traders in general want to enter positions in line with the dominant
market trend.
As the major currencies are paired with the US Dollar we can follow their dominant direction by analyzing the US Dollar.
If the US Dollar is bearish, the following pressure for the majors would be;
Bullish = AUD/USD, EUR/USD and GBP/USD.
Bearish = USD/JPY, USD/CAD and USD/CHF.
Direction of US Dollar for the next few years;
For the longer term direction of the US Dollar, Deutsche Bank believes that the dollar cycles have historically lasted around six to 10 years. As at 26 march 2013 Deutsche bank believes that the downtrend ended in 2011 and has now entered a sustained multi year uptrend. The article is located here www.businessinsider.com.au/chart-long-term-us-dollar-cycles-2013-3
Current Forex Market Forecast by brainyforex
10 September 2014 Looking at the gold chart.

Market Commentary
As at 22 October 2012
In our prior forecast of 11 September 2012 (see below) it was stated ... "Our next downside target is the natural square level of 79.00".
As seen from the above "Weekly Chart" we can see that price has been reacting on this 79.00 natural square level. So far failing to move under it.
Where to from here and it's influence on the majors?
Answer = "Unknown?"
The market has been moving sideways for the prior 5 weeks and continues to do so to the present day.
As is, can only expect more of the same sideways price action.

Market Commentary
As at 11 September 2012
In our prior forecast of 30 July 2012 (see below) it was said ... "Should price move under the prior week low of 82.59 this will signal that the current uptrend has halted and we should see the dollar moving down to test lower support levels, the first target being 81.00".
Price followed that path and now we have confirmed weakness in the US Dollar. As shown on the above weekly chart (11 September 2012) we see a break in the 81.00 support level and also a break in the weekly swing low, thereby signaling more weakness to follow.
Our next downside target is the natural square level of 79.00.
Just remember that price usually retraces backup towards an old broken support level to test it before making further lows. In this case there is a strong possibility that price will move backup towards the 81.00 (may not reach it though?) before falling towards the 79.00 target level.
Price pressure continues for the medium time frame as follows:
Bullish = AUD/USD, EUR/USD and GBP/USD.
Bearish = USD/JPY, USD/CAD and USD/CHF.
[NB : Beware of short-term retracements in the opposite direction].

Market Commentary
As at 30 July 2012
From last week we anticipated the US Dollar to move higher, which did not happen. Last weeks forecast as seen below also mentioned that it would be important for the 83.50 natural square level to hold as support for further higher price moves. As shown on the above weekly chart we now see IMMEDIATE DANGER for the US Dollar.
Should price move under the prior week low of 82.59 this will signal that the current uptrend has halted and we should see the dollar moving down to test lower support levels, the first target being 81.00.
Price pressure now changes as follows on the intermediate time frame:
Bullish = AUD/USD, EUR/USD and GBP/USD.
Bearish = USD/JPY, USD/CAD and USD/CHF.
[NB : The next few days will show if 82.59 level breaks for more lower prices / sideways. Time vibration shows uptrend has halted for the time being. See the white line on above chart].

Market Commentary
As at 23 July 2012
Once again, as anticipated on our prior forecast the US Dollar retraced before moving upwards to current level of 83.79 this Monday morning 23 July 2012. [See above chart]
Where to from here?
Anticipate upwards direction. Watch natural square levels for resistance at 86.00 and more importantly 88.50. Also remember price moves higher in wave formations - expanding and retracing. With this forecast its important that the current price support level of 83.50 holds.
Price pressure will continue as follows on the intermediate time frame:
Bearish = AUD/USD, EUR/USD and GBP/USD.
Bullish = USD/JPY, USD/CAD and USD/CHF.
[NB Reminder : Beware that there are no certainties in forecasting as Governments can intervene in apparently so called "freely traded markets" and step in and manipulate price through what are called their "dirty floats" ].

Market Commentary
As at 9 July 2012
As anticipated on our prior forecast the US Dollar retraced back to 81.16 on the 18 June (read below) and started moving back upwards from there. [See above chart]
Where to from here?
On last Friday price closed on 83.56. A natural square level as show on the above chart is 83.50, which means that price is currently fighting against resistance.
If price continues above this 83.50 level expect this level to form support and creating a wave three formation which should see price head up toward the 86.00 level.
Over the next few days lets watch how price reacts to this resistance level. If price fails to exceed the 83.50 level immediately, expect it to do so after a minor pullback.
US Dollar is in uptrend as shown on the weekly chart, which means price pressure will continue as follows on the intermediate time frame:
Bearish = AUD/USD, EUR/USD and GBP/USD.
Bullish = USD/JPY, USD/CAD and USD/CHF.
[NB : If US Dollar hits resistance on the current 83.50 level expect prices to move opposite that shown above for the "immediate" time frame].

Market Commentary
As at 7 June 2012
As anticipated on our prior forecast the US Dollar hit resistance on the 83.50 level (read below) and started retracing back down.
Where to from here? As the US Dollar is in a uptrend on the weekly chart we can expect price to start moving back upwards after retracing towards the natural square level of 81.00. Will price go all the way down and hit the 81.00 mark? Answer : Probably close to it? See the above chart (daily chart).
We now have price pressure as follows:
Bullish = AUD/USD, EUR/USD and GBP/USD.
Bearish = USD/JPY, USD/CAD and USD/CHF.
UNTIL the US Dollar stops falling further. Which is probably the 81.00 level.
Once the 81.00 level is hit (or near it) expect a upward move in the US Dollar thereby creating reverse pressure as follows:
Bearish = AUD/USD, EUR/USD and GBP/USD.
Bullish = USD/JPY, USD/CAD and USD/CHF.
The US Dollar may reach the 81.00 price level around 22 June 2012.
As WD Gann would say "lets watch as price reacts on these levels and confirms the forecast so as not to get ahead of the market".

Market Commentary
As at 18 May 2012
Surprise surprise. Price of US Dollar blasted past the strong resistance level of 81.00 as shown on the above WEEKLY chart.
A Gann principle is that "old resistance becomes support". So lets watch price retrace back to the 81.00 level and not sink further before price continues to move higher toward the next resistance level of 82.80 - 83.50 which is 61.8% fibonacci level and natural square level respectively.
As price continues to move northwards we can expect more downward pressure on EUR, GBP & AUD until US Dollar hits the next resistance level between 82.80 - 83.50.
The converse is applied to JPY, CAD & CHF.
Bear in mind as US Dollar retraces back to 81.00 EUR, GBP & AUD will retrace upwards or move sideways for a short time.

Market Commentary
As at 14 May 2012
The US Dollar is reaching toward 81.00 level as shown on the above chart. We can expect price to stall on this level and even reverse.
When? Sometime before the end of this week.
Expect to see continued downward pressure on EUR, GBP & AUD until US Dollar hits the 81.00 resistance level. After this prices will reverse and see EUR, GBP & AUD move upwards.
The converse is applied to JPY, CAD & CHF.
Above US Dollar DAILY chart shows the following;
1. Price approaching old resistance / support level of 81.00 which is also a natural square level. (white line) and
2. 81.00 level also being a 50% of a prior range level (blue line).

Market Commentary
As at 25 February 2012
The US Dollar closed the week on it's low of 78.40.
This has now provided evidence that it's attempted appreciation last week was futile. For a while early last week it looked like it had the strength for a bull rally - which did not eventuate.
Now we see from the weekly Dollar chart above 'huge weakness' in the form of the following;
1. Price under old support / resistance level of 79.00 which is also a natural square level.
2. Price moved under the prior week low.
3. Bearish candle pattern with price closing under the prior week low.
A weakening US Dollar means "strength" for the Euro, British Pound and Australian Dollar. Also, the converse (opposite) for Japanese Jen, Canadian Loonie and Swiss Franc. These three should see a depreciation in value and move downwards.
Bullish = AUD/USD, EUR/USD and GBP/USD.
Bearish = USD/JPY, USD/CAD and USD/CHF.

Market Commentary
As at 15 February 2012
The US Dollar has now moved ABOVE the 79.00 natural square level, 79.78. The vibration line on the chart shows its down time is complete for the present and we should see it move upwards from here toward the 81.00 natural square level. Notice also it's bullish nature by moving above the prior week high.
A strengthening US Dollar means "weakness" for the Euro, British Pound and Australian Dollar. Also, the converse (opposite) for Japanese Jen, Canadian Loonie and Swiss Franc. These three should see an appreciation in value and move upwards.
Bearish = AUD/USD, EUR/USD and GBP/USD.
Bullish = USD/JPY, USD/CAD and USD/CHF.
Update Market Commentary
As at 1 February 2012
The US Dollar has now moved down to 79.42 and found (temporary?) support near the 79.00 natural square level which has been a prior support / resistance area in the past.
The US stock market as represented by the DJIA is having problems staying above the 12,700 natural square level. (Currently 12,633).
This now means that we should see "weakness" in the current bullish moves for the Euro, British Pound and Australian Dollar. Also, the converse (opposite) for Japanese Jen, Canadian Loonie and Swiss Franc. These three should see a (temporary?) halt to their recent declines.
Market Commentary
As at 25 January 2012
As seen on the weekly chart of the US Dollar (shown below) we notice that price currently at 79.93 has moved under the prior week low in addition to breaking under its price vibration and natural square level as explained by WD Gann.
We can now anticipate further falls from here. (As long as the 81.00 NSQ level is not breached to the upside).
For currency traders this means that price pressure will be as follows;
Bullish = AUD/USD, EUR/USD and GBP/USD.
Bearish = USD/JPY, USD/CAD and USD/CHF.
[Experienced traders recommend waiting for a retracement or pullback in price before entering a position so as to reduce risk. There are no 100% certainties as to price direction due to unexpected unforeseen world events. Risk only what you can afford to lose.]

Market Commentary
As at 13 June 2011
Last Friday, 10th June 2011 we saw a bearish weekly candle price closing (11,951) under the natural square level for the DJIA which means we should have a high probability of a continued down trend continuing.
On the US Dollar weekly chart, 10 June 2011 (chart insert) we see a bullish candle formation closing above the natural square level. This signifies a high probability that price will continue to moving upwards from the 75.19 level.
This means pressure continues as follows;
Bearish = AUD/USD, EUR/USD and GBP/USD.
Bullish = USD/JPY, USD/CAD and USD/CHF.

DJIA and US Dollar Weekly Chart as at 10 June 2011.
Market Commentary
As at 11 May 2011
The US dollar has now moved above it's prior week high indicating a good chance of further upward action. We also see that last weeks price formation shows a 'bullish candle' right on the natural square support level, giving us further confidence of the continuation of the (temporary) bullish move in the US Dollar.
This means pressure moves to;
Bearish = AUD/USD, EUR/USD and GBP/USD.
Bullish = USD/JPY, USD/CAD and USD/CHF.

US Dollar Weekly Chart as at 11 May 2011.
Market Commentary
Update At 21 April 2011
The US dollar as of yesterday broke under it's prior week low, which means that it's back to the original forecast of;
Pressure;
Bullish = AUD/USD, EUR/USD and GBP/USD.
Bearish = USD/JPY, USD/CAD and USD/CHF.
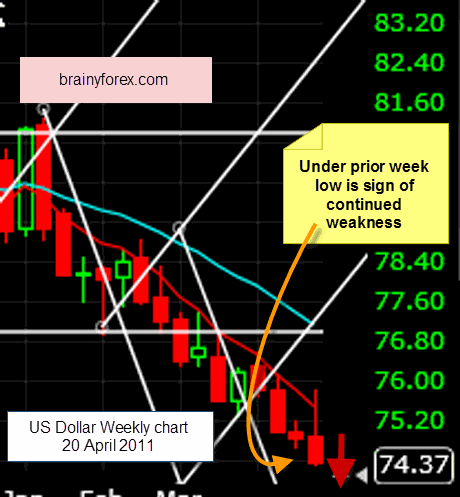
US Dollar Weekly Chart as at 20 April 2011.
Market Commentary
Update At 18 April 2011
As seen from the chart below, we notice that the US Dollar has now exceeded its prior week high. This now causes a change in the forecast. We now see temporary pressure move as follows;
Bearish = AUD/USD, EUR/USD and GBP/USD.
Bullish = USD/JPY, USD/CAD and USD/CHF.
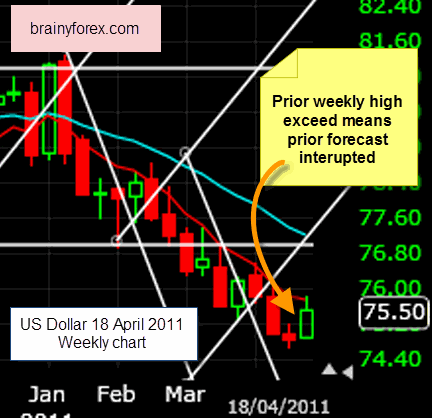
US Dollar Weekly Chart 18 April 2011.
Market Commentary
At 30 March 2011
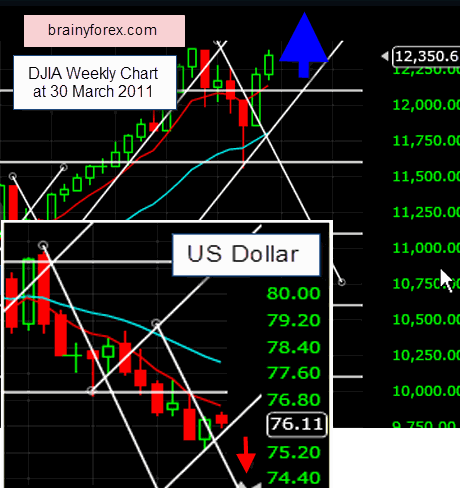
US Dollar Weekly Chart 30 March 2011.
From the two charts above of US Stock Market and US Dollar (insert) we see a reversal from our previous forecast. The DJIA has moved above its time vibration and about its 12,100 natural square level.
The US Dollar failed to exceed its natural square level, thereby indicating further weakness.
For the last few weeks we saw the DJIA and US Dollar were out of sync, thereby resulting in mostly sideways price action for the currencies.
As noted on the US Dollar chart insert, once price moves under its prior week low it will cause a break in its vibration level thereby causing price to fall further. This will mean the pressure for the major currencies should soon be as follows;
Bullish = AUD/USD, EUR/USD and GBP/USD.
Bearish = USD/JPY, USD/CAD and USD/CHF.
Market Commentary
At 10 March 2011
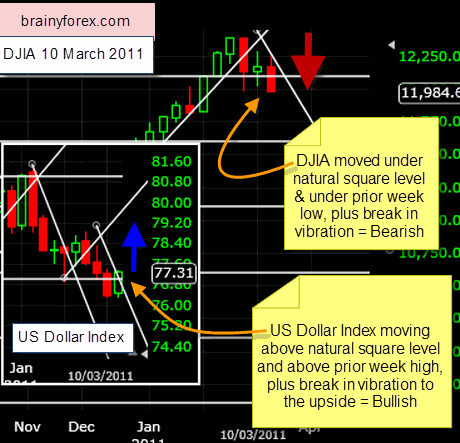
US Dollar Daily Chart 10 March 2011.
From the two charts above of US Stock Market and US Dollar we see a weakening of the prior bullish move in the US Stock Market.
As noted on the chart, notice three major indications that show weakness; For DJIA 1) Price moving under prior week low. 2) Price moving under natural square level of 12,100 points and 3) Time expiration by break of vibration line.
For the US Dollar chart insert we see the exact opposite of all three points mentioned for the DJIA.
This forecast should hold true if there is no major reversal in Friday's direction.
We can be prepared for next week that the inter-market effect on price pressure for the major currencies to be as follows;
Bearish = AUD/USD, EUR/USD and GBP/USD.
Bullish = USD/JPY, USD/CAD and USD/CHF.
Market Commentary
At 14 February 2011
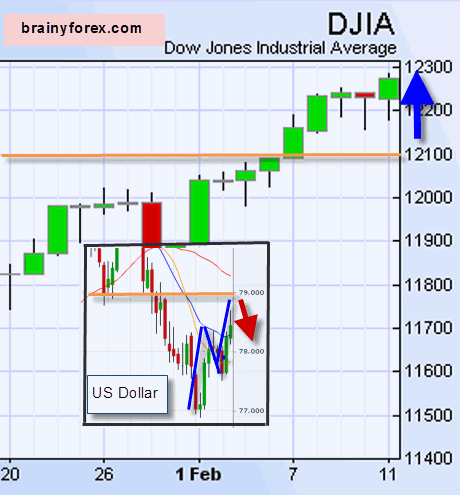
DJIA Daily Chart 11 February 2011.
The above chart shows the US stock market to be bullish. We also notice the orange natural square levels for both the DJIA and the US Dollar coming into play.
On the US Dollar chart insert, notice a zig zag formation which is likely to finish on the 79c level followed by a continued downward move.
The effect should be as follows;
Bullish = AUD/USD, EUR/USD and GBP/USD.
Bearish = USD/JPY, USD/CAD and USD/CHF.
Market Commentary
At 8 February 2011
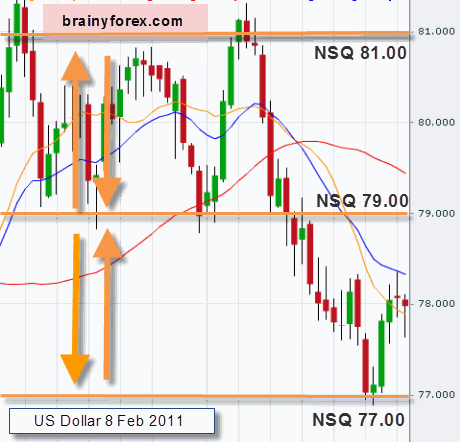
US Dollar Daily Chart 8 February 2011.
Price 77.97.
As price is moving a little sideways we notice the NSQ (natural square levels) which may give us an indication of what price will do once it reaches these levels. The main levels currently as shown are 77, 79 and 81c.
Since price is in a trading range we turn our attention to the US stock market and notice that it is currently trending strongly upwards / bullish which means our current forecast from the 20 January remains in tact.
From the bearish nature of the US Dollar expect the following price pressure to continue;
Bullish = AUD/USD, EUR/USD and GBP/USD.
Bearish = USD/JPY, USD/CAD and USD/CHF.
Market Commentary
At 20 January 2011
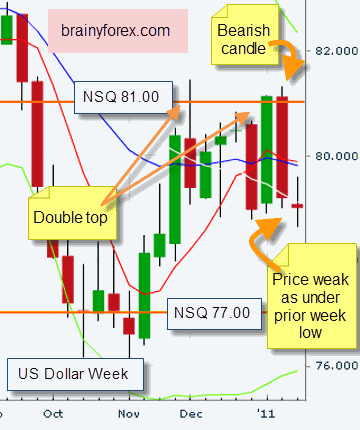
US Dollar Weekly Chart 20 Januaray 2011.
Price 78.99.
We now see weakness in the US Dollar based on the weekly chart. As shown on the chart notice the double top, price moving under the prior week low as well as last weeks bearish candle formation. Plus, price rejected the 81.00 natural square level.
WD Gann said that the best chart to see what the market was doing was the "WEEKLY CHART".
From the bearish nature of the US Dollar expect the following price pressure;
Bullish = AUD/USD, EUR/USD and GBP/USD.
Bearish = USD/JPY, USD/CAD and USD/CHF.
Brainyforex Newsletter [SUBSCRIBE HERE]
Brainyforex Tip - EA's to watch;
Automic Trader Click here. (Affiliate link)
King Robot Click here. (Affiliate link)
(NB : Affiliate commissions help assist running costs of brainyforex.com without any extra cost for purchaser).
Need software to test and improve your trading strategy? We have special coupon discount codes here.


