- Home
- Ifc Markets
- Technical Analysis XAUUSD 28 October 2014
Technical Analysis XAUUSD 28 October 2014
by IFC Markets

XAUUSD (Gold) futures H4 price chart
Gold rush: final round
Markets are frozen in the situation of uncertainty: minutes of Federal Open Market Committee are expected to be announced today, which will define the near future of the monetary policy. The Fed is assumed to be ready to complete the QE program: the economy recovery is being maintained, the labor market is quite stable.
However, it is possible that the measures may be temporarily put off, due to highly volatile financial markets. If the basic expectations would still be justified, we should expect the immediate US currency strengthening and the fallen prices on precious metals futures. The latter is more likely to happen also due to the recovery continuation in the US stock market, and investors tend to give up on defensive assets in favor of risky investment.
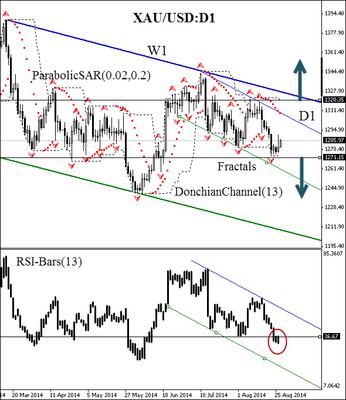
Here we consider the XAUUSD (Gold) futures on the H4 price chart. 28 October 2014. The retracement of the daily bearish trend has been over, and an unstable downtrend is being formed now. It is confirmed by the Donchian Channel (13). The situation is still uncertain: we can see the upward breakout of the H4 trend line, and the price has prepared to move sideways. Nevertheless, due to the general price direction of the market, there is a high probability of this breakout to be false, so the price would cross down the trend line.
Thus, when crossing the fractal support level at $1221.42 per ounce, we expect the Parabolic reversal moving in the direction of the red zone. This mark can be used for placing a pending sell order. It is recommended to wait for the confirmatory RSI-Bars level breakout at 27.3536%, which was confirmed three times (!) by the oscillator signal. We expect it to happen at the same time or before the bearish price movement below 1221.42. Stop Loss is better to be placed at the strong fractal resistance level at 1233.88, which is confirmed by Parabolic historical values and the Donchian Channel top boundary.
After position opening, Trailing Stop is to be moved after the Parabolic values, near the next fractal high. Thus, we are changing the probable profit/loss ratio to the breakeven point.
Position Sell
Sell stop below 1221.42
Stop loss above 1233.88
Daily Technical Analysis by IFC Markets
Read previous articles by IFC Markets here
Return to IFC Markets Articles.


